Fleet View
The Peridio Console Fleet View provides unprecedented visibility into your device fleet's health, deployment status, and operational trends. This feature enables better decision-making through instant insights.
If a user has permissions to view Fleet View, it will be the default landing page when entering an organization.
Permissions
To view the Fleet View, a user must have the fleet_view_read permission.
Any user with user_update and org_user_permission_update permissions can update the fleet_view_read permission for another user.

Features
Filter Controls
There are several top-level filter controls which affect various parts of the Fleet View data.
The Range filter controls the time range of the data shown in both the Device Count and Device Events charts. This can be a window as low as 60 minutes up to 90 days.
The Last Seen filter narrows counts of devices to those that have connected to the Peridio platform within the filter's window of time. This can be a window as low as 60 minutes up to 90 days, or All Time. When this filter is set to Disabled , devices that have never connected to the Peridio platform will be counted as well.
There are also top-level controls for Product, Cohort and Tags. These options will filter to a single product, cohort, or tag, respectively. These filters also apply to various parts of the Fleet View as noted below.
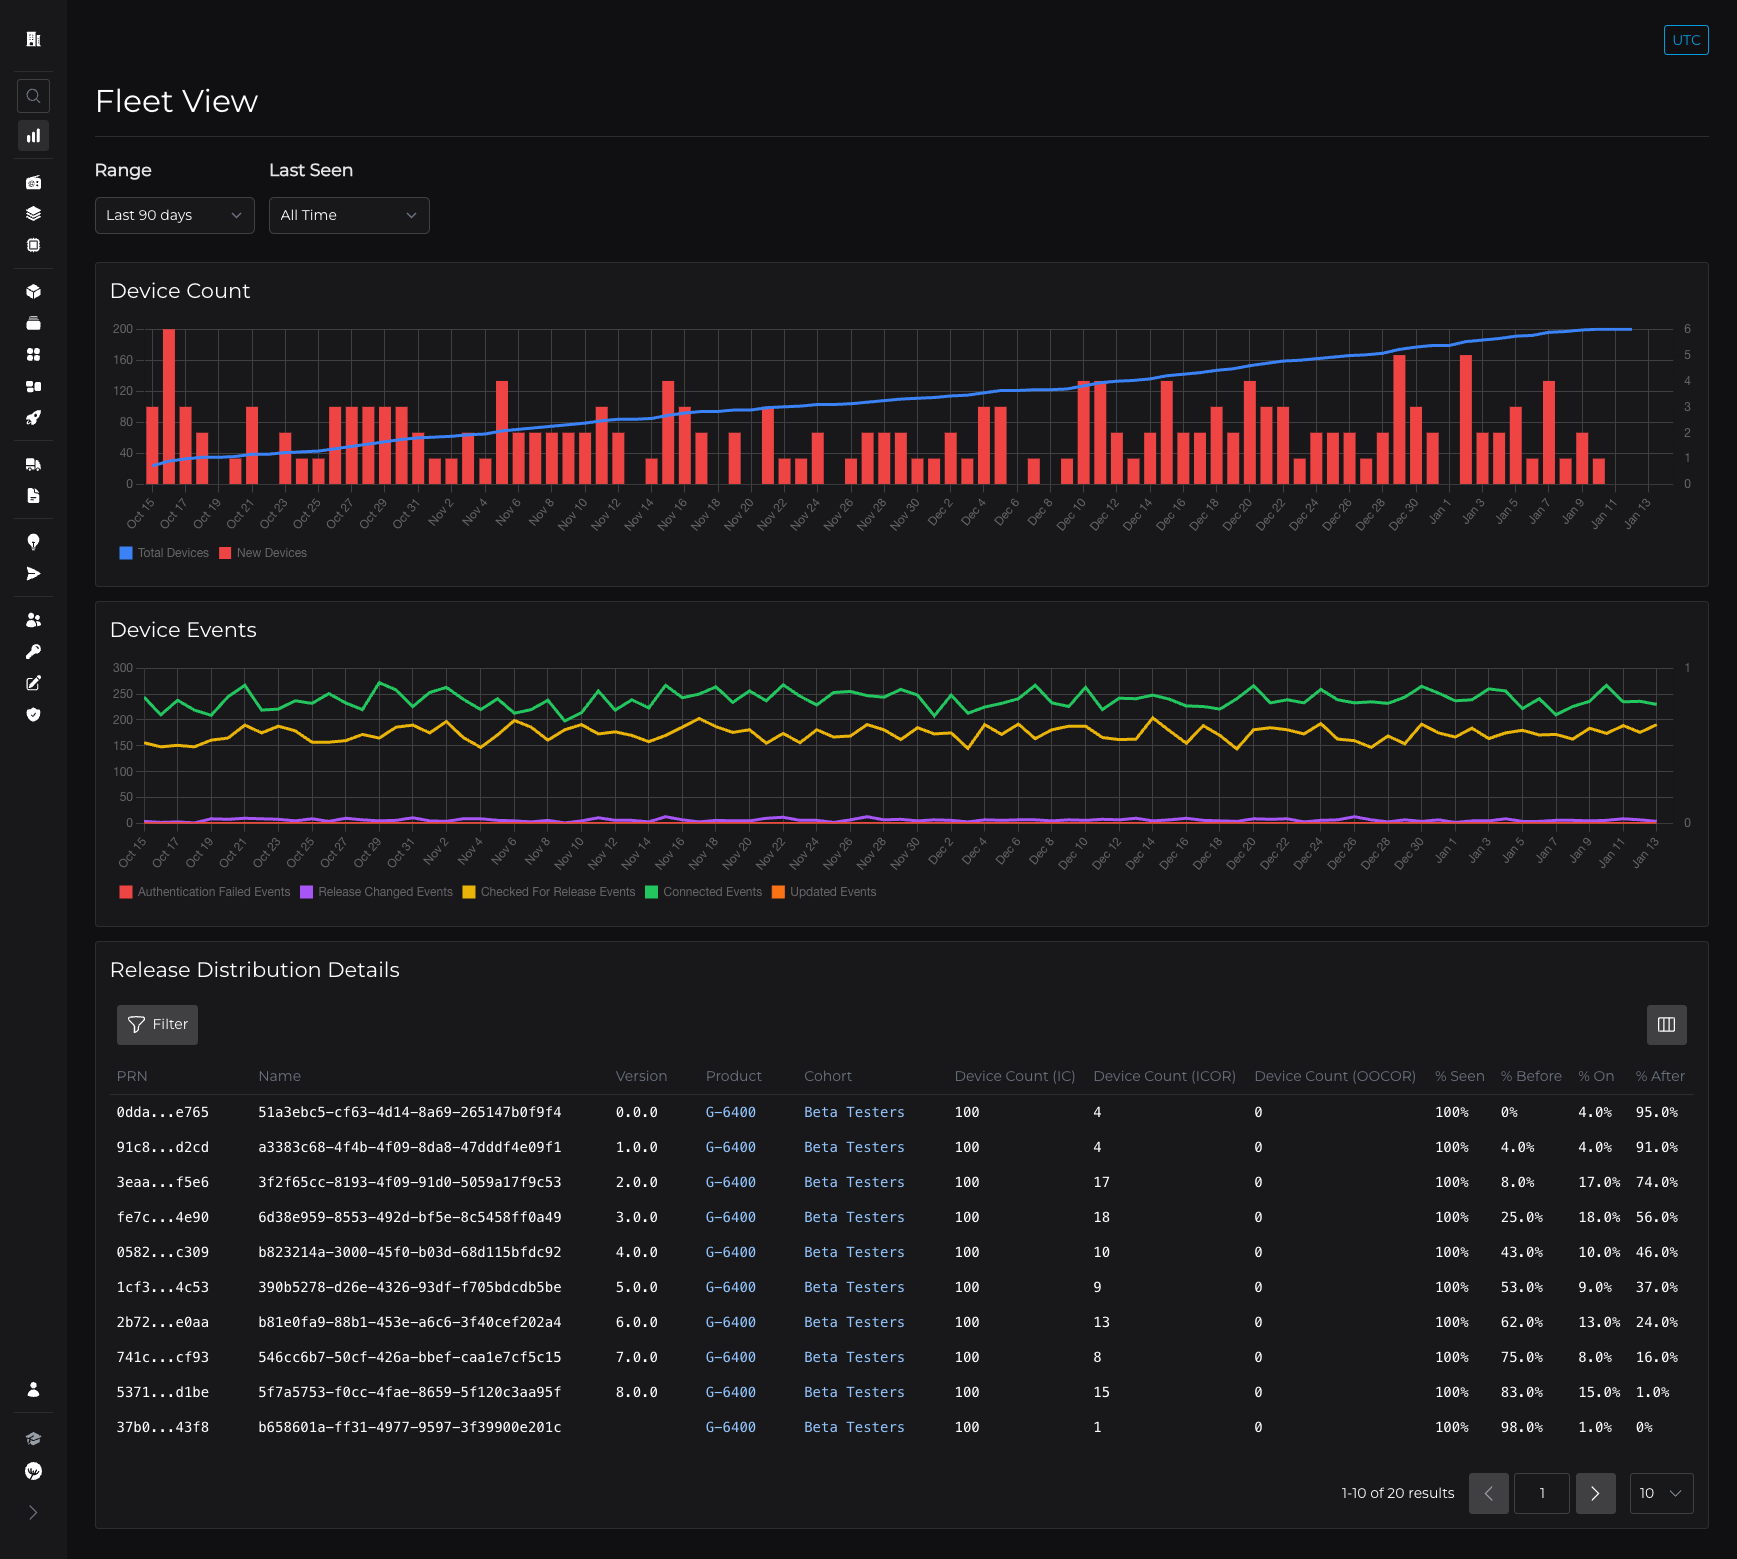
Device Count
This chart shows a total count of devices over time, as well as a count of new devices created over time. Deleting devices will cause the total count to decrease.
This chart is affected by the Range, Last Seen, Product, Cohort, and Tags filters.
Device Events
This chart shows a count of device events over time. Click the device name in the chart's legend to toggle each data series on and off.
This chart is affected by the Range, Last Seen, Product, Cohort, and Tags filters.
Release Adoption
This chart shows device counts for up to five (5) releases over time. This data is sampled in near real-time, and therefore does not contain any data prior to March 6, 2025. As the count of devices on any given release changes from second to second, the shown count value represents an average count for the data point period (day, hour, 6h, 1h, 15m, or 5m period).
By default, this chart will show the current top five releases by device count.
This chart also supports selecting/showing a NULL option, which represents a count of devices that are not on any release.
Release Distribution Details
This table shows all releases across the entire organization. By default, releases are ordered by cohort name and release version.
This table is not affected by the Range filter, but is affected by the Last Seen, Product and Cohort filters.
In addition to core release attributes, the table includes statistics about each release: total device count in the release's cohort (IC), device count on the release and in the release's cohort (ICOR), and device count on the release, but out of the release's cohort (OOCOR).
The percentage of "seen" devices is defined as a device that has connected to the Peridio platform within the current Last Seen filter's value. When this filter is set to a Disabled state, the shown values will represent devices with at least one connected event.
Lastly, there are statistics showing the percentage of devices that are on the given release, before it, or after it. All these columns support sorting to provide quick ordering of releases by meaningful measurements.
Hover table column headers to view more detailed descriptions. Hover percentage values to see actual device count numbers.